Core Architecture
Your First 30 Days as a Jamf Pro Administrator, Part 2: Learn How It Operates
You have inventoried the environment. You know what exists. Week two is about watching how it actually behaves.
Reading policies and profiles in the console tells you what was intended. Week two tells you what is actually happening. The jamf binary, the check-in cycle, the log files, and a test device are your instruments. You are not changing production — you are developing the mental model you need to make changes safely when the time comes.
Flavors of Management
For most day-to-day troubleshooting on a managed Mac, you will encounter two traditional management paths constantly: the Jamf management framework and Apple’s MDM framework. Jamf Pro also uses Declarative Device Management for supported workflows and status reporting, which we will treat separately rather than folding it into either of the other models.
The jamf binary is a command-line application that lives on every enrolled Mac at /usr/local/jamf/bin/jamf, with a symbolic link at /usr/local/bin/jamf. It is the older of the two management mechanisms, dating back to Jamf’s origins as Casper Suite. The binary operates as a pull model: it runs on a schedule, contacts the Jamf Pro server, and asks whether there is anything it should do. The server responds, and the binary carries out the task — installing a package, running a script, updating inventory. Policies are the primary work of the jamf binary.
MDM is a push model. When a device falls into scope for a configuration profile, or when an administrator issues a remote management command, Jamf Pro sends a notification through Apple Push Notification service (APNs) prompting the device to contact the server for instructions. MDM commands are delivered this way — remote wipe, remote lock, profile deployment and removal. MDM does not depend on the jamf binary at all.
Understanding this distinction explains behaviors that otherwise seem inconsistent. A configuration profile appears on a device quickly because MDM pushed it. A policy takes up to 15 minutes to run because the binary is waiting for its next check-in. A remote wipe begins quickly because it is delivered through the MDM channel rather than waiting for recurring policy check-in. A custom script requires a check-in or a manual trigger because it runs through a policy.
Official documentation: Components Installed on Managed Computers
The Recurring Check-In Cycle
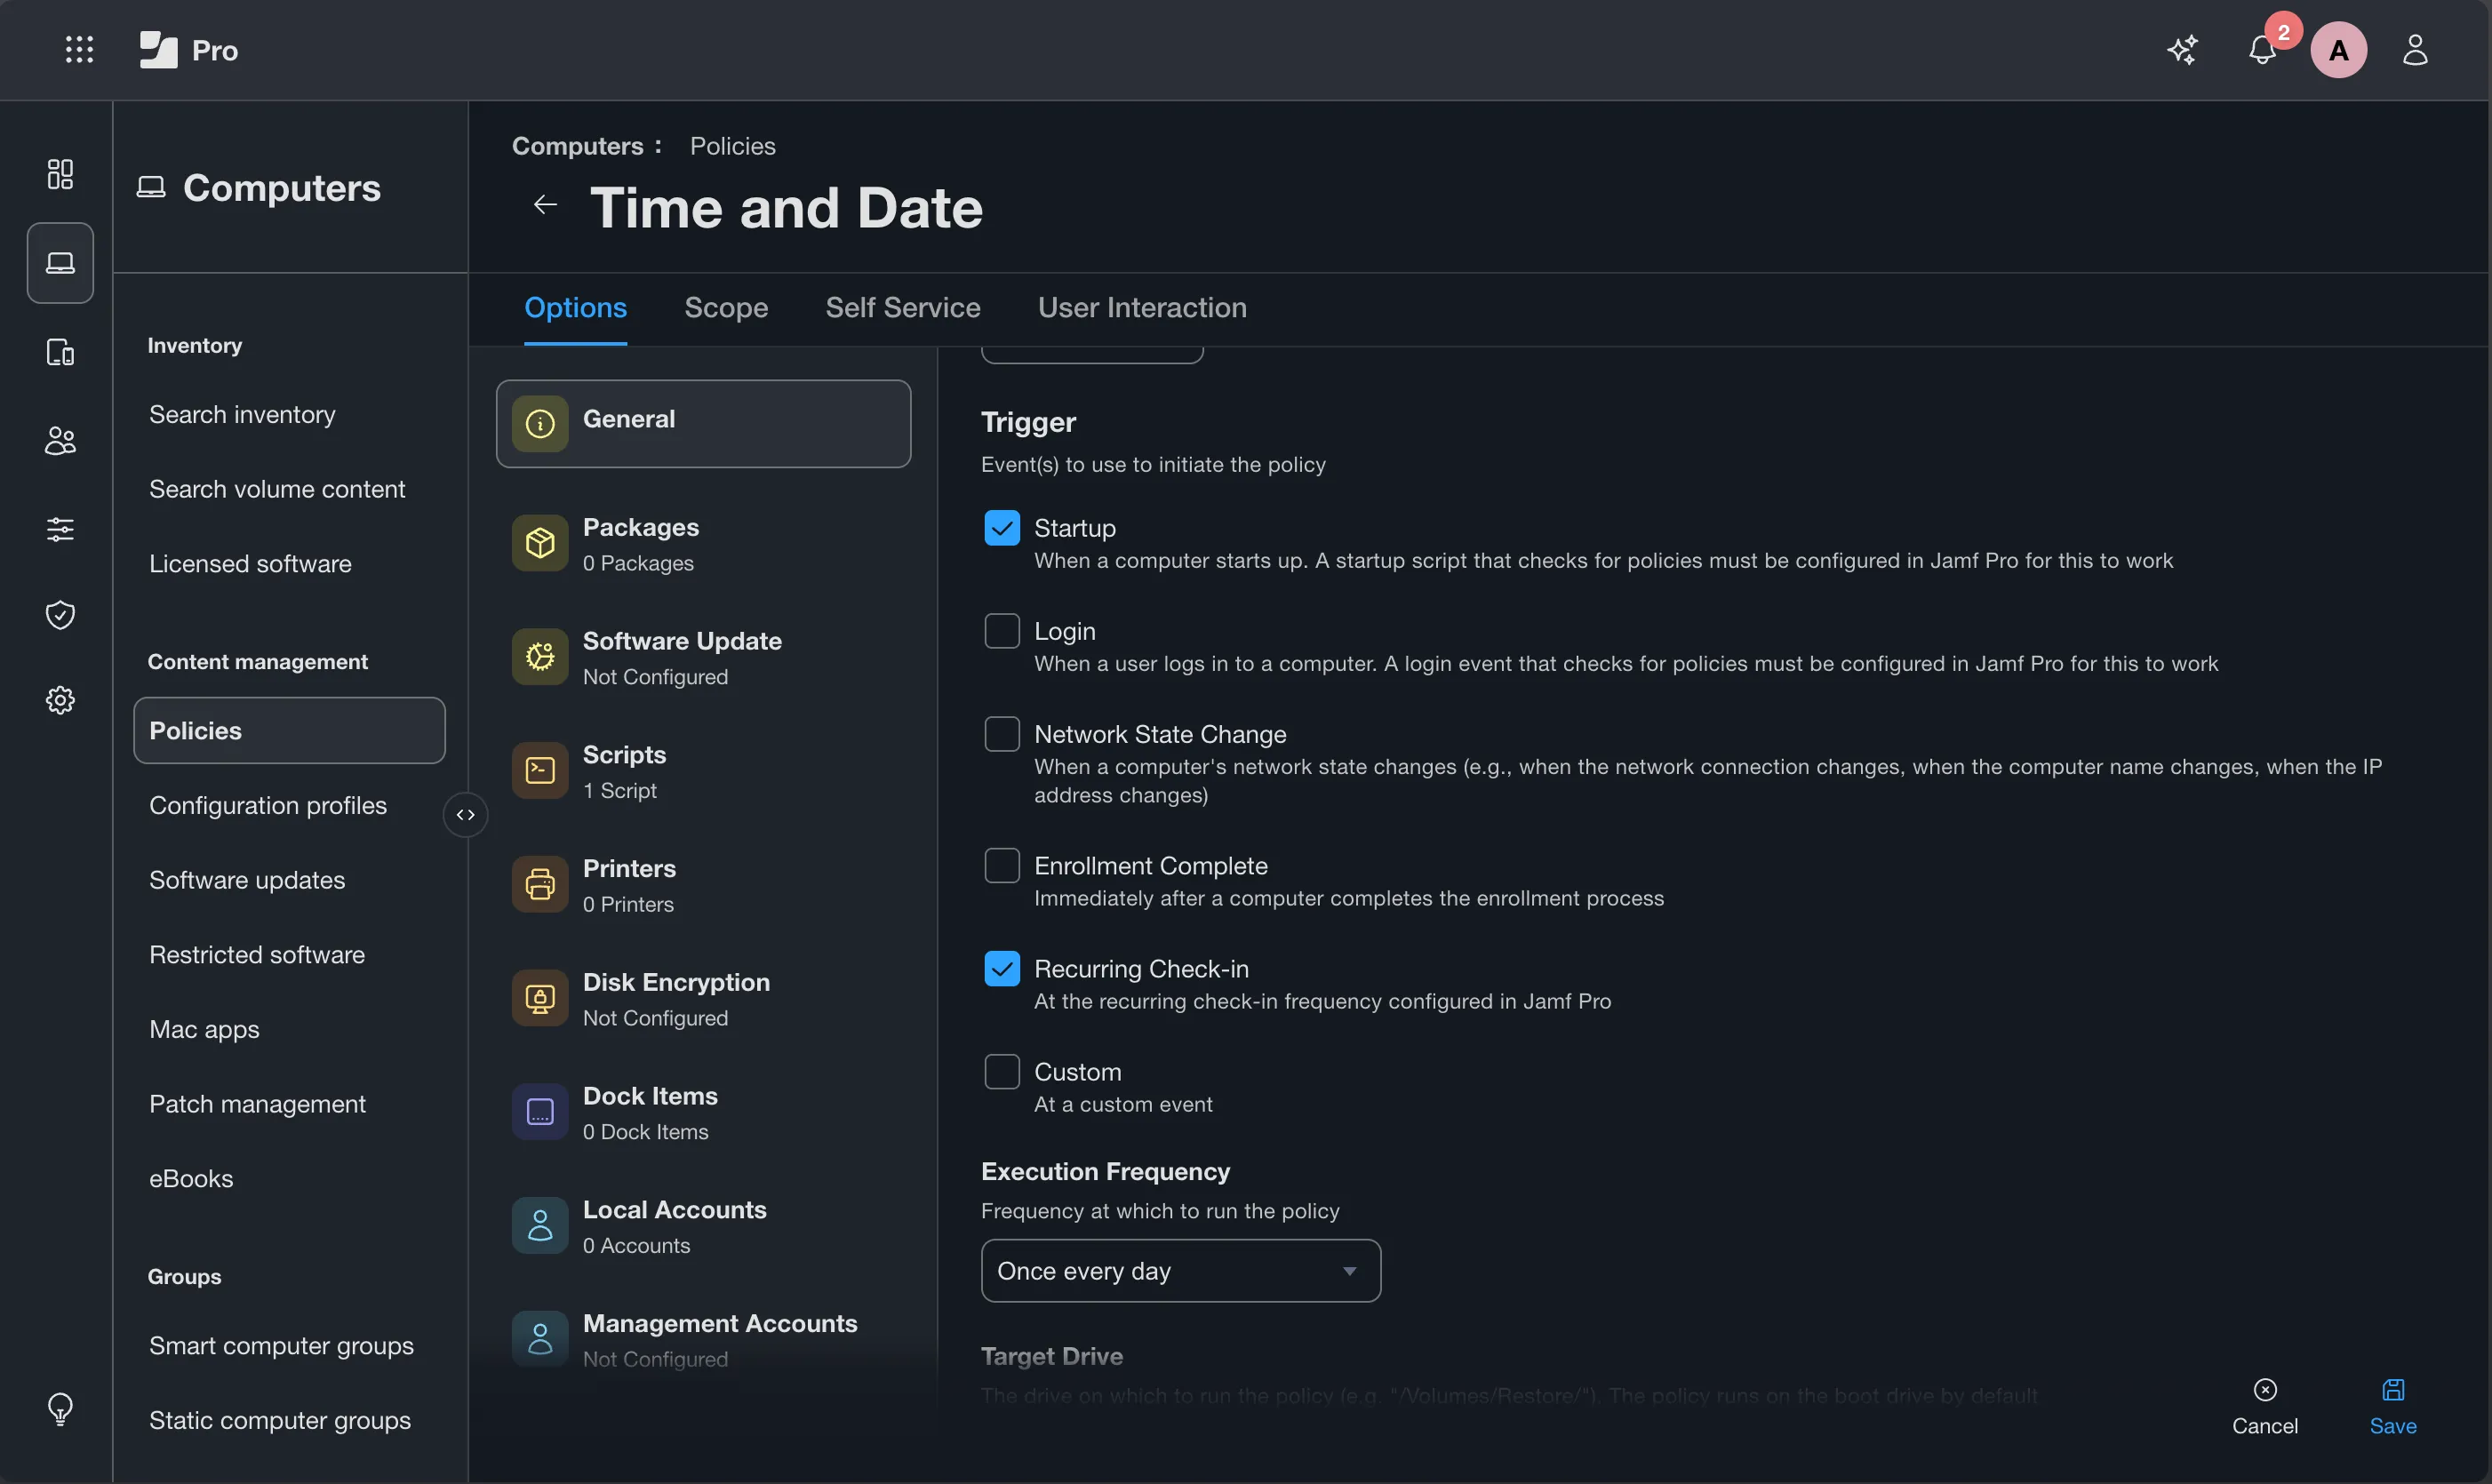
The jamf binary checks in with the Jamf Pro server on a configurable schedule. The default check-in frequency is every 15 minutes. At each check-in, the binary evaluates which policies have a Recurring Check-in trigger and are scoped to the device, then runs any that qualify based on their execution frequency settings.
To find the check-in frequency configured in your environment, navigate to Settings → Computer Management → Check-In. This is a global setting that applies to all managed Macs. The check-in frequency is worth noting during your week one inventory — a very short interval (such as every 1 minute) can indicate a misconfiguration or a previous administrator’s attempt to speed up policy delivery, and it will put unnecessary load on both devices and the server. The default of 15 minutes is appropriate for most environments.
Each managed Mac maintains its own recurring check-in schedule rather than every computer contacting Jamf Pro simultaneously. In practice, check-ins are naturally distributed across the configured interval, preventing large fleets from behaving like a synchronized scheduled task. Internally, the Jamf management framework also introduces a small randomized delay to help distribute recurring check-ins across the fleet.
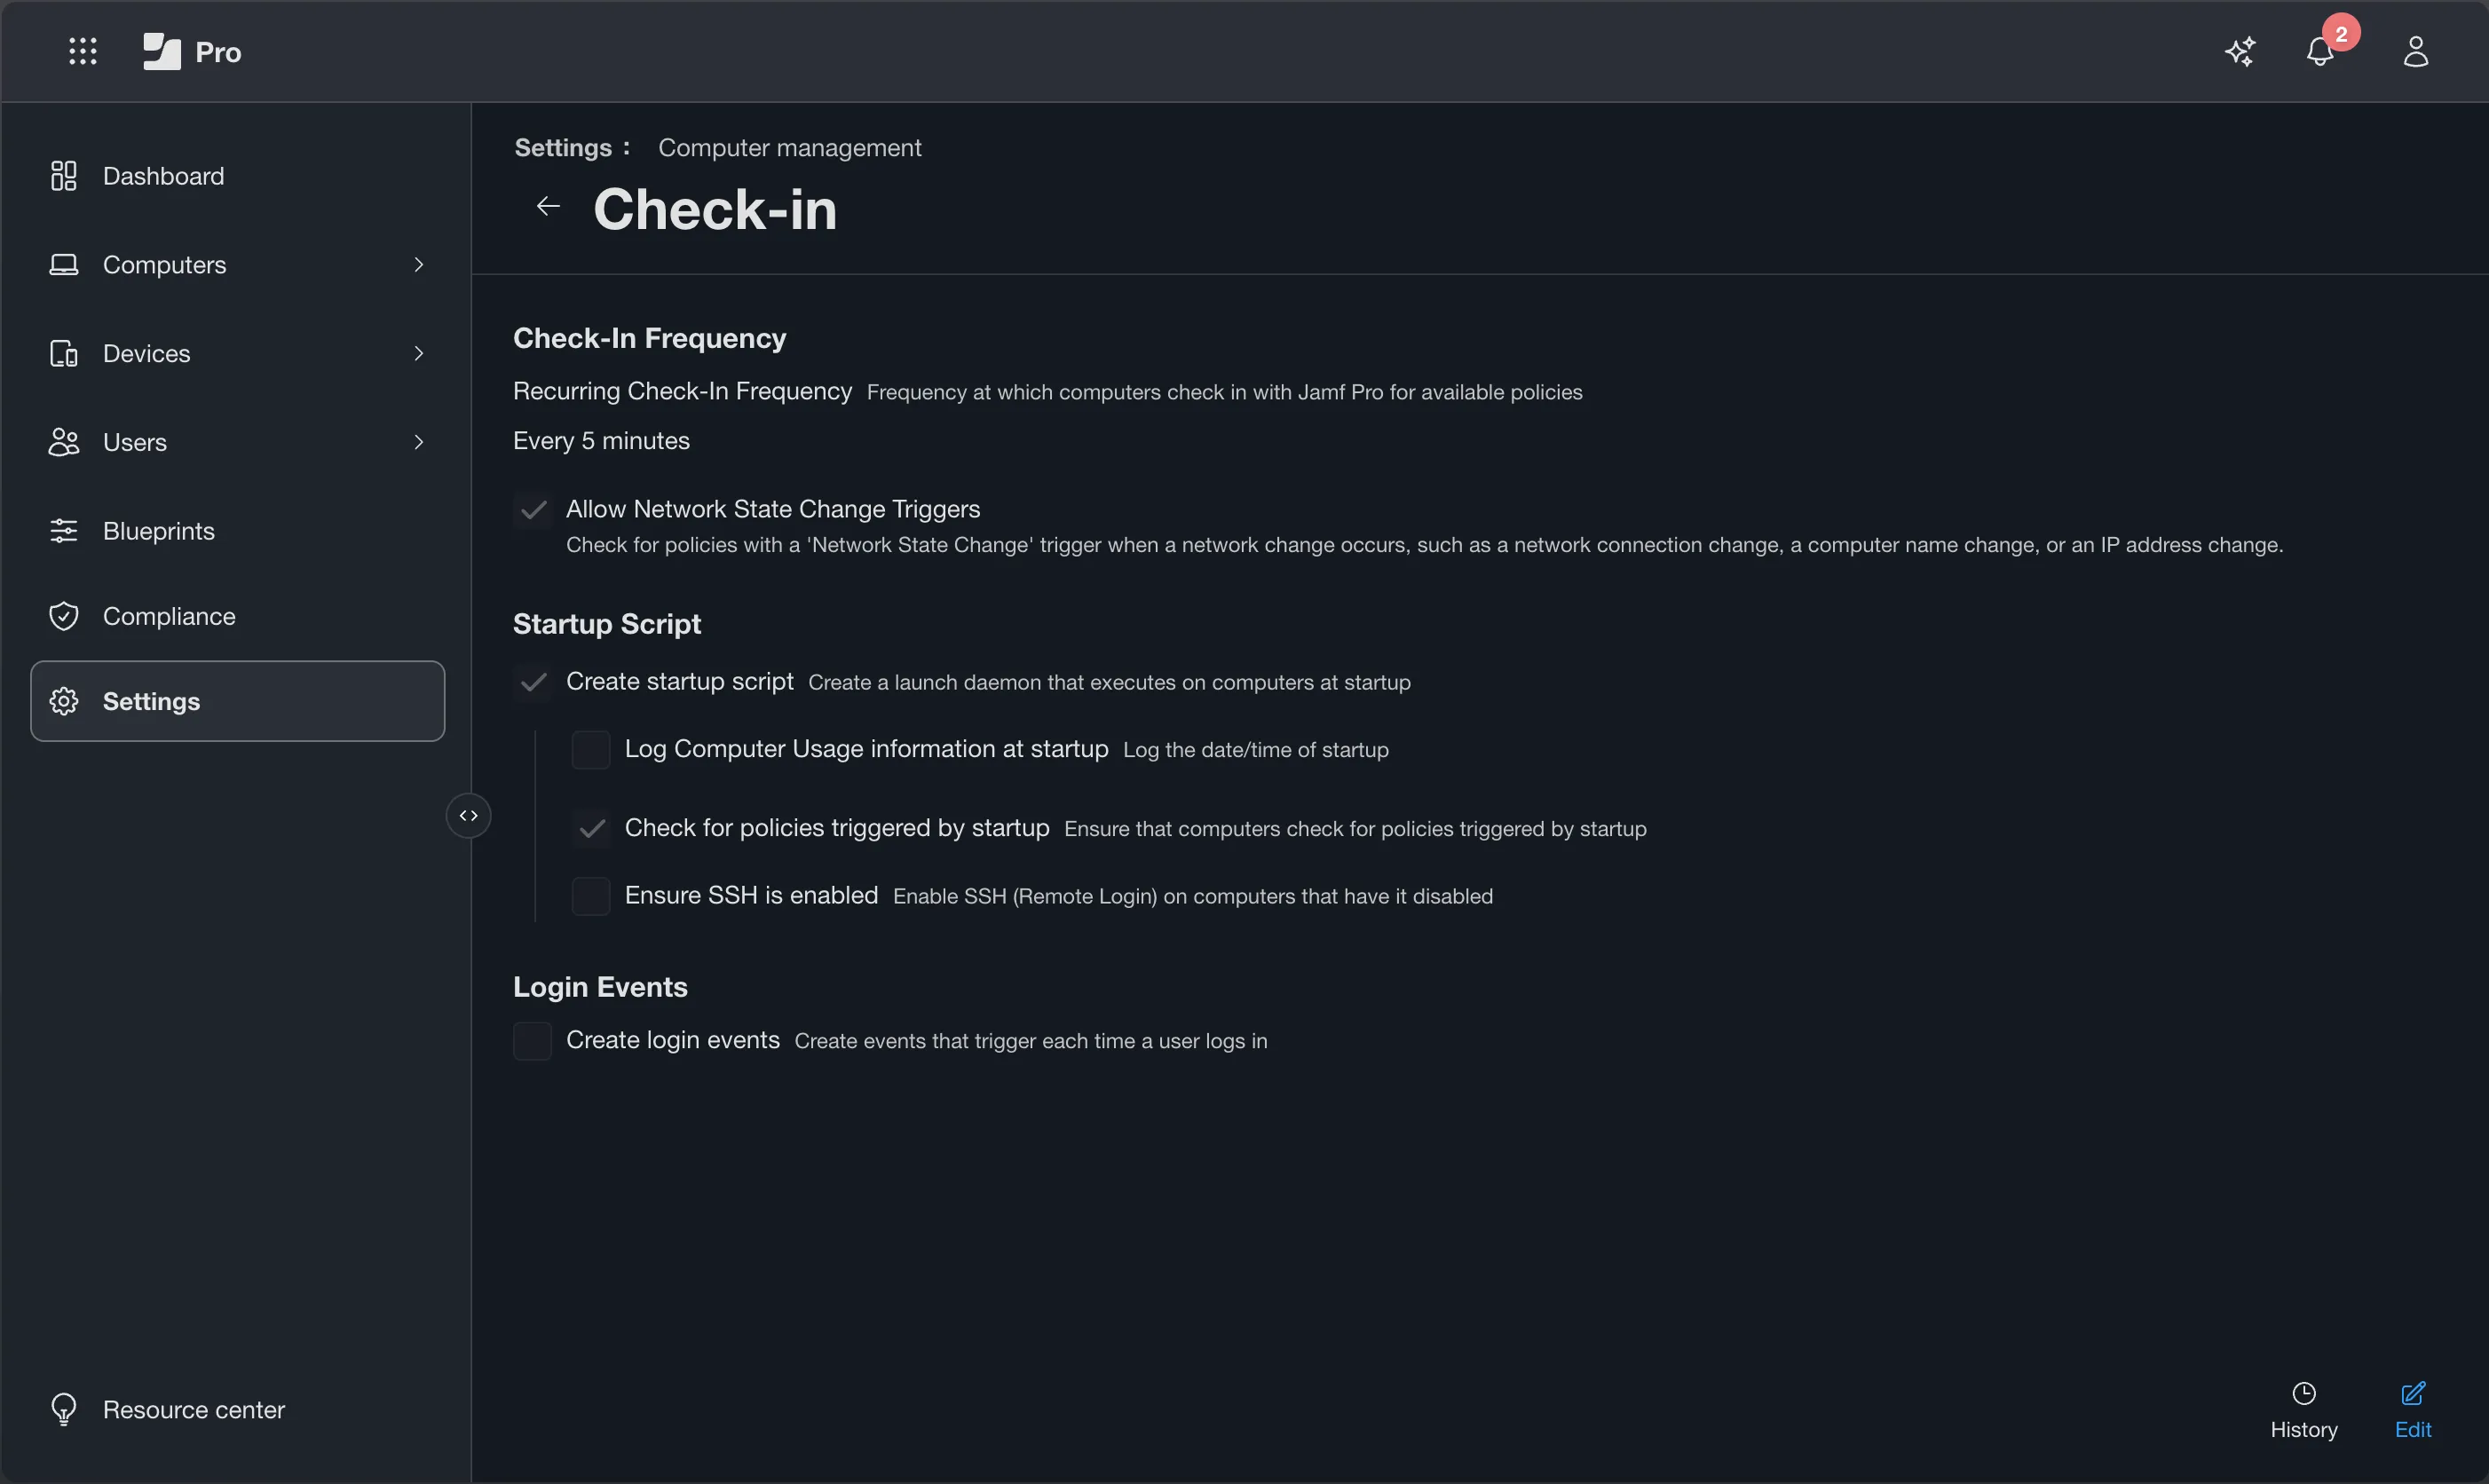
Official documentation: Recurring Check-in Frequency
Policy Execution — What Actually Happens
When troubleshooting why a policy did or did not run, work through the following sequence to better understand it:
- Trigger evaluation — does a policy with this trigger exist that is scoped to this computer?
- Scope evaluation — is this computer included by the policy’s targets and limitations, without being removed by an exclusion?
- Execution frequency check — has this policy already run on this computer the maximum number of times allowed by its execution frequency setting?
- Payload execution — scripts run first if configured to run before packages, then packages install, then any remaining payloads in the order configured
- Result logging — success or failure is written to the policy log in Jamf Pro and to
jamf.logon the computer
Because jamf binary execution is predictable, troubleshooting is predictable too. Understanding this sequence explains most of the policy behavior you will encounter. A policy will not run if it fails any of the first three checks. If a computer is in scope but the policy does not run, the execution frequency setting is the most common reason — particularly policies set to Once per Computer that have already run, or policies whose logs have not been flushed.
Script exit codes matter. A script should return 0 when it completes successfully and a meaningful non-zero value when it fails. Jamf records script failures in policy results, which makes proper exit handling essential for troubleshooting. This is also important for any workflow that evaluates policy success or retries. When reviewing inherited scripts, verify that scripts exit cleanly with 0 on success and meaningful non-zero values on failure.
One additional behavior matters when several policies share a trigger: Jamf Pro runs simultaneously-triggered policies in alphanumeric order by policy name. That means that if inherited policies depend on one another, the policy naming may be functional rather than cosmetic. Do not “clean up” odd numeric prefixes until you know why they exist.
Reading Logs — Console Side
Jamf Pro records the result of every policy execution. There are two ways to view this from the console, and both are worth knowing.
From the policy itself:
Navigate to Computers → Policies, locate the policy, and click Logs in the bottom-right corner of the policy view. This displays a list of every device that has attempted the policy, with its execution status and timestamp. Clicking Details next to a specific device shows the full execution log including script output, package installation results, and any error messages.
This view answers the question: “Which devices ran this policy, and what happened?”
Jamf Pro truncates policy log output after 25 KB in current versions. If a long script produces extensive output, the console may contain only part of what happened. That is another reason to correlate server-side policy logs with jamf.log on the affected Mac.
From the computer record:
Navigate to a specific computer record and select the History tab. The Policy Logs category shows every policy that has run on that device, in chronological order, with status and timestamps.
This view answers the question: “What has happened on this specific device?”
Both views are useful and serve different troubleshooting purposes. When a user reports that something did not install, the computer record’s policy logs give you a device-centric timeline. When you want to know whether a deployment reached all its targets, the policy-level log gives you the fleet-wide picture.
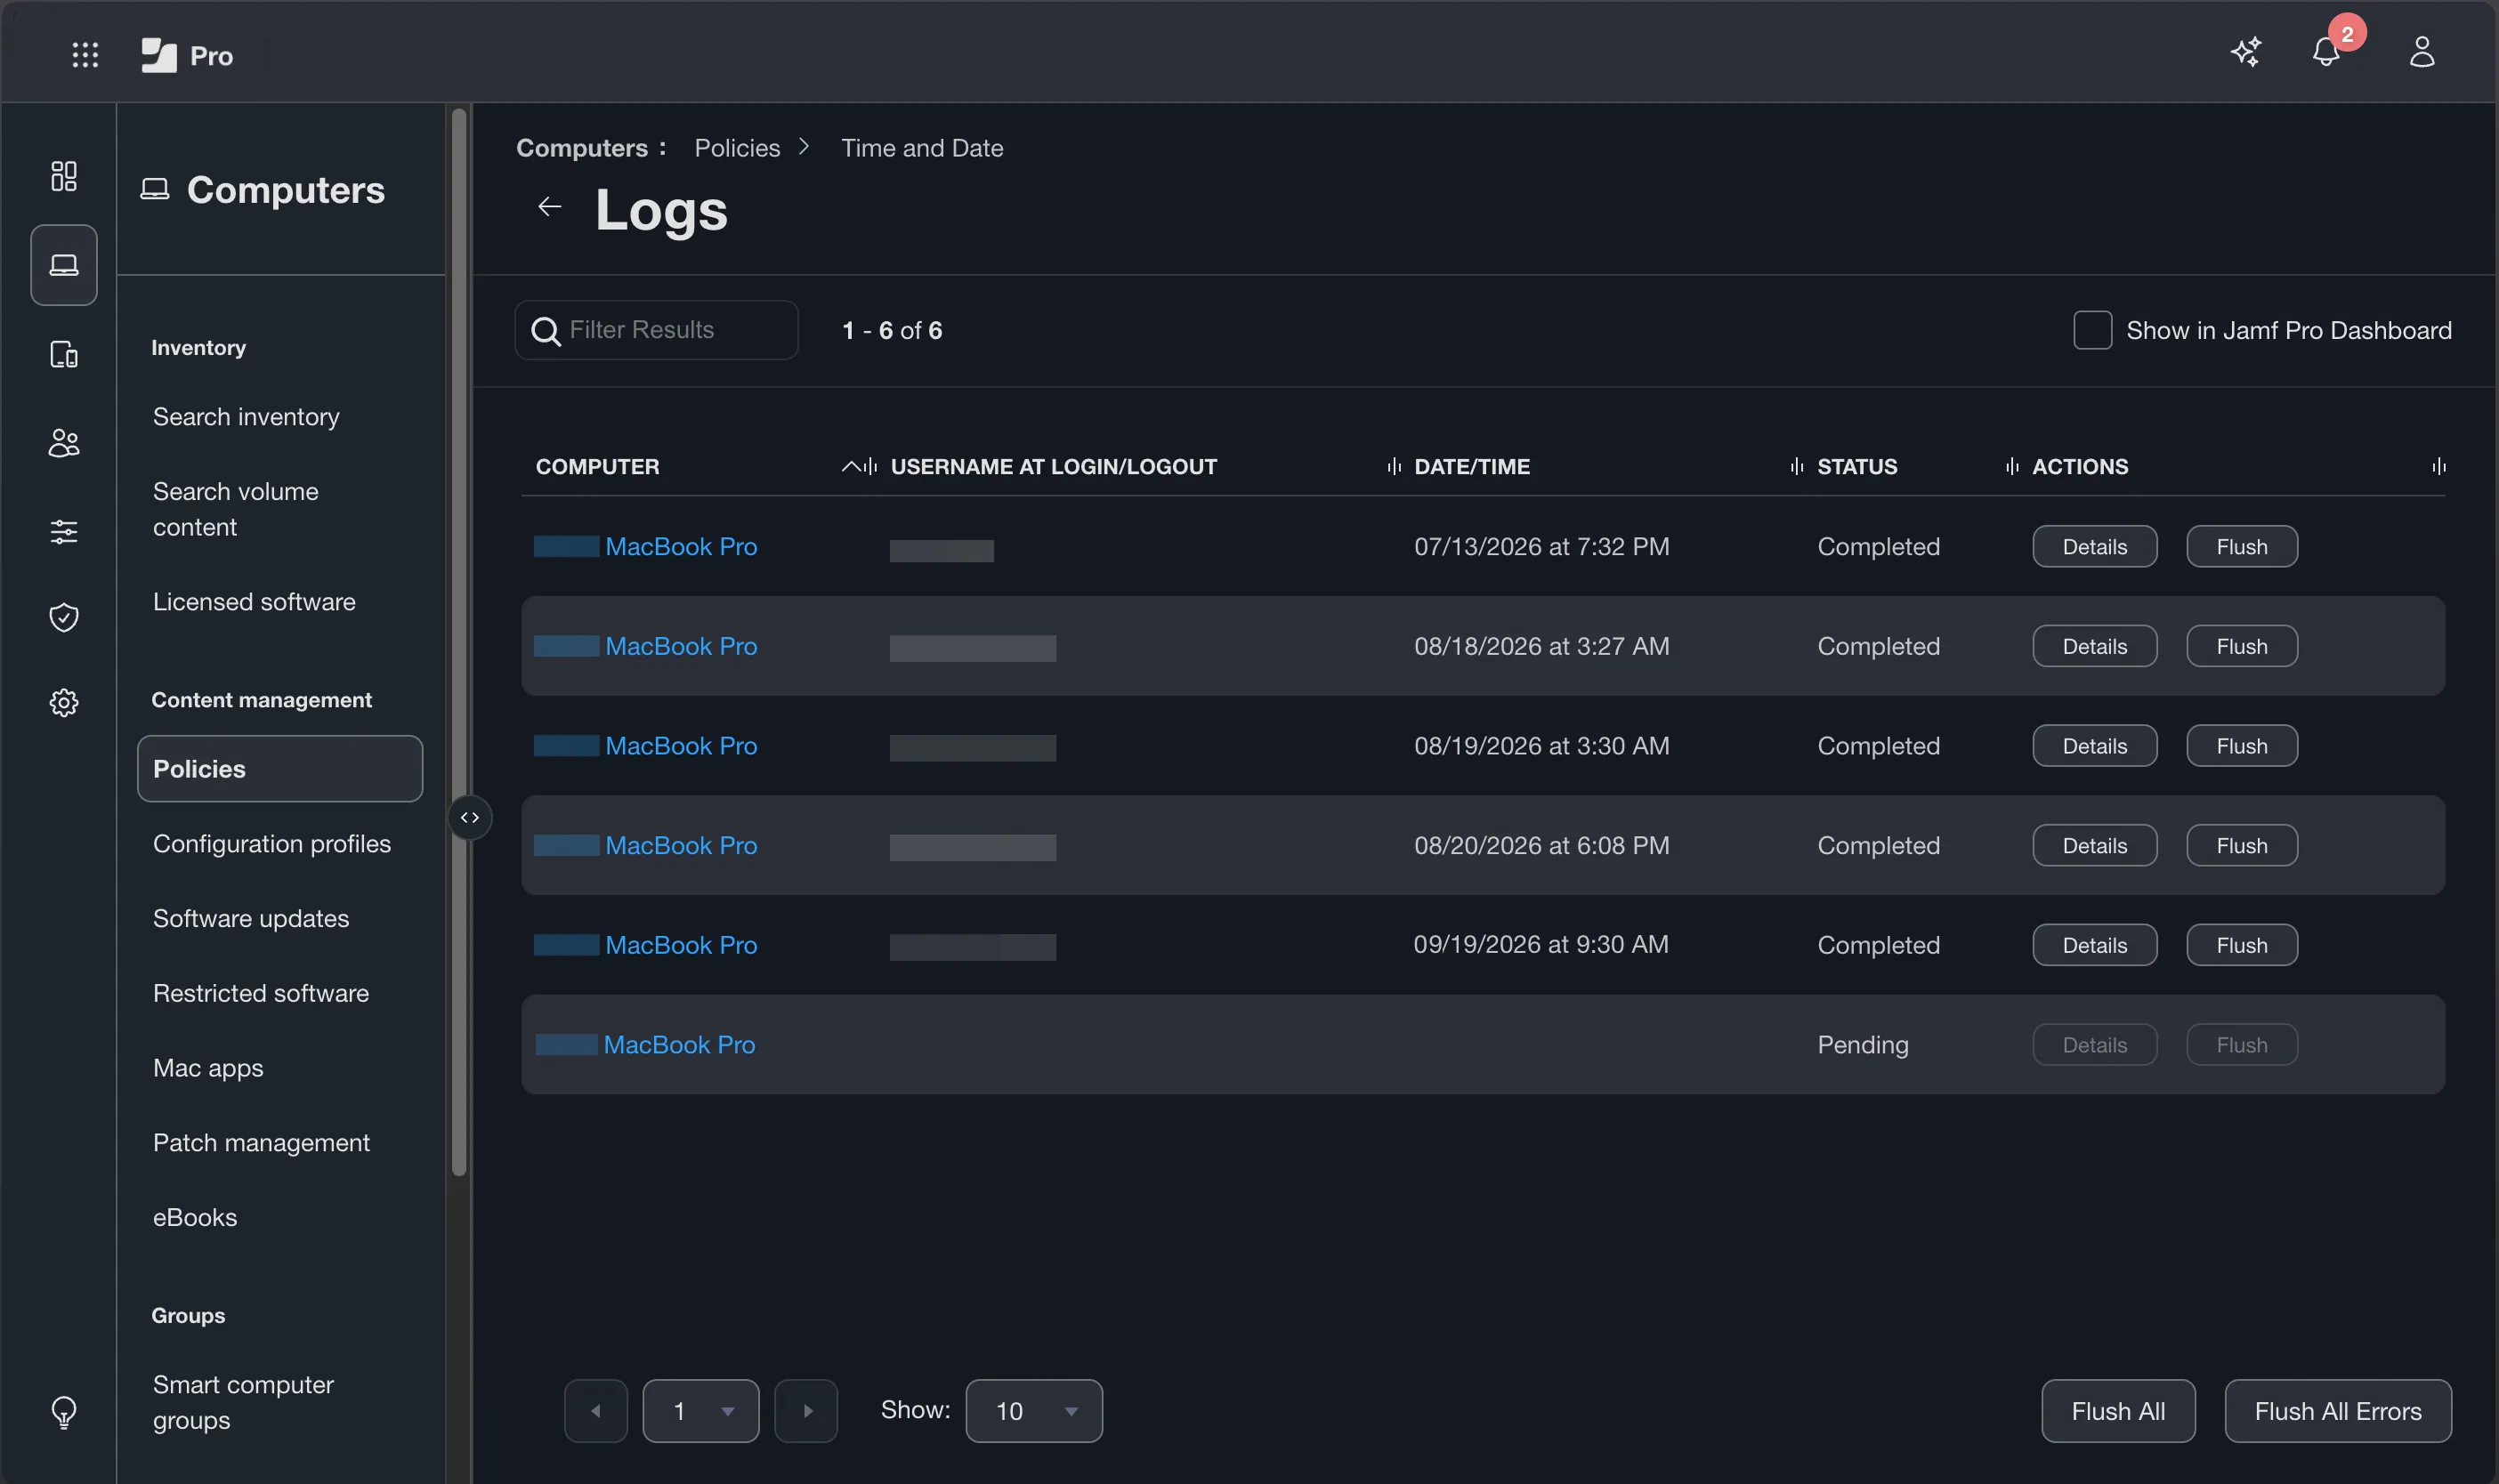
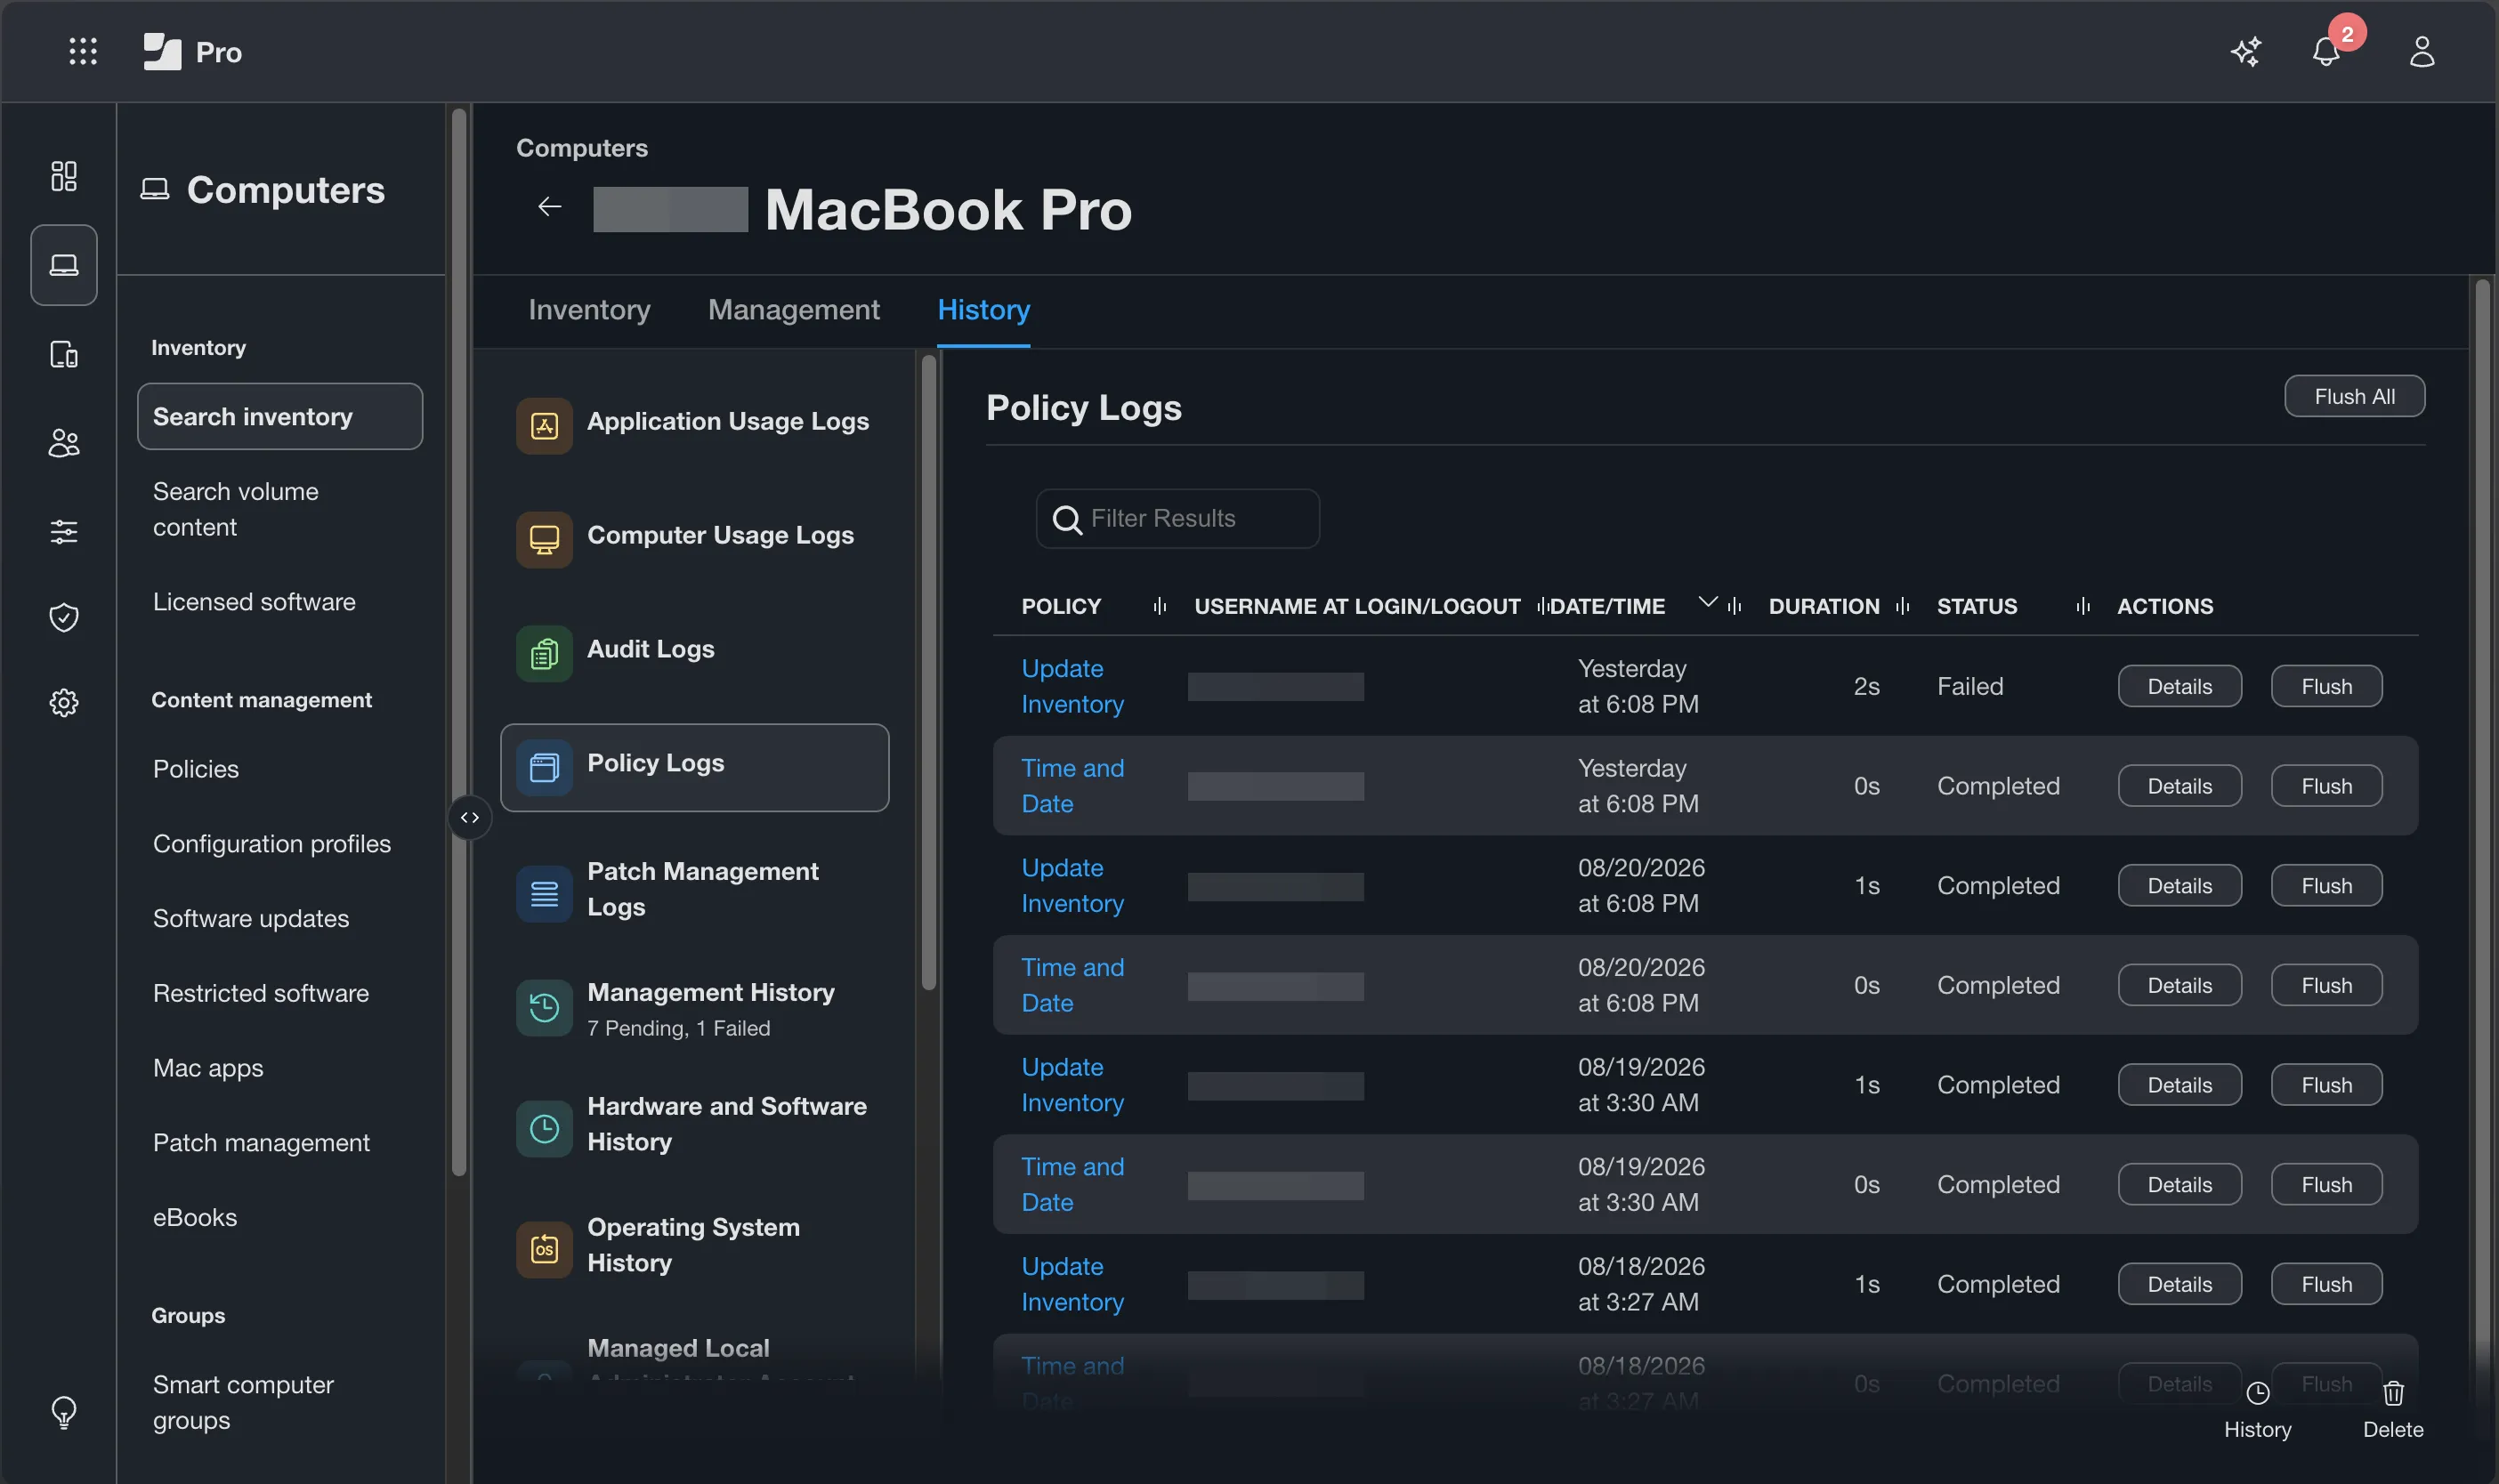
Official documentation: Computer History Information · Viewing and Flushing Logs for a Policy
Reading Logs — On the Device
The console gives you structured log data. The device gives you raw log output that is often more detailed and more useful for diagnosing failures.
/var/log/jamf.log
This is the primary on-device log for the jamf binary. Every check-in, every policy execution, every script invocation, and every package installation writes here. When a policy fails in the console but the error message is truncated or unclear, jamf.log usually contains the full output.
To read it from the terminal:
# View the last 100 lines of jamf.log
tail -100 /var/log/jamf.log

# Follow jamf.log in real time while triggering a policy
tail -f /var/log/jamf.logThe tail -f pattern is particularly useful during testing. Open a terminal window with tail -f /var/log/jamf.log running, then trigger a policy from the console — you will see the execution in real time as it happens. Press Control-C when you are finished following the log.
/var/log/install.log
Package installation events are written here. If a package installs through a Jamf policy but the installation behavior is unexpected, install.log provides the detailed installer output that jamf.log does not capture.
# View recent install.log entries
tail -100 /var/log/install.logThe log command
For broader macOS system events and MDM activity, the native log command provides access to the unified logging system. MDM commands and profile activity appear here alongside other system events.
# View MDM-related log entries from the last 30 minutes
log show --last 30m --predicate 'subsystem in {"com.apple.ManagedClient", "com.apple.mdmclient", "com.apple.dmd"}' --style compactOfficial documentation: Components Installed on Managed Computers
Running the jamf Binary Manually
You can invoke the jamf binary directly from the terminal on any managed Mac. This is useful for testing, for diagnosing check-in behavior, and for forcing specific operations without waiting for the next scheduled check-in.
A few commands worth knowing during week two:
# Verify that the Mac can reach the Jamf Pro server
sudo jamf checkjssconnection

# Trigger an inventory update (recon) immediately
sudo jamf recon

# Trigger a recurring check-in policy evaluation
sudo jamf policy

# Trigger a policy by its custom event name
sudo jamf policy -event your-custom-event-name

# Display the version of the jamf binary installed on this Mac
jamf versionjamf checkjssconnection is the fastest sanity check when a device is not behaving as expected. If it cannot reach the server, policy execution is not possible regardless of what the console shows.
jamf recon forces an inventory update immediately, which is useful after making changes to the device that Jamf should know about — changing the computer name, installing or removing software, or modifying any data that feeds Extension Attribute scripts.
sudo jamf policy without any flags triggers a full recurring check-in evaluation, running any policies that qualify at that moment. Combining this with tail -f /var/log/jamf.log in a second terminal window gives you real-time visibility into exactly what the binary is doing.
The jamf binary runs as root when invoked with sudo. The root execution context is similar to the context used for policy scripts, which makes Terminal useful for reproducing individual commands during troubleshooting. Keep in mind that Jamf can also pass policy-specific parameters to scripts, so manual execution is not always identical to policy execution.
Scoping in Practice — Why a Device Does or Does Not Get Something
Smart Groups power most policy and profile scope in Jamf Pro. When a device is not receiving something it should, or receiving something it should not, the first question is always whether its Smart Group membership is correct.
Smart Groups evaluate dynamically based on inventory data that Jamf Pro has received. As Jamf Pro receives updated inventory, Smart Group membership is recalculated automatically. This means Smart Group membership is only as current as the device’s last inventory update.
This distinction matters during troubleshooting. If software was changed locally but Jamf Pro has not yet received updated inventory, a software-version Smart Group may still reflect the previous state.
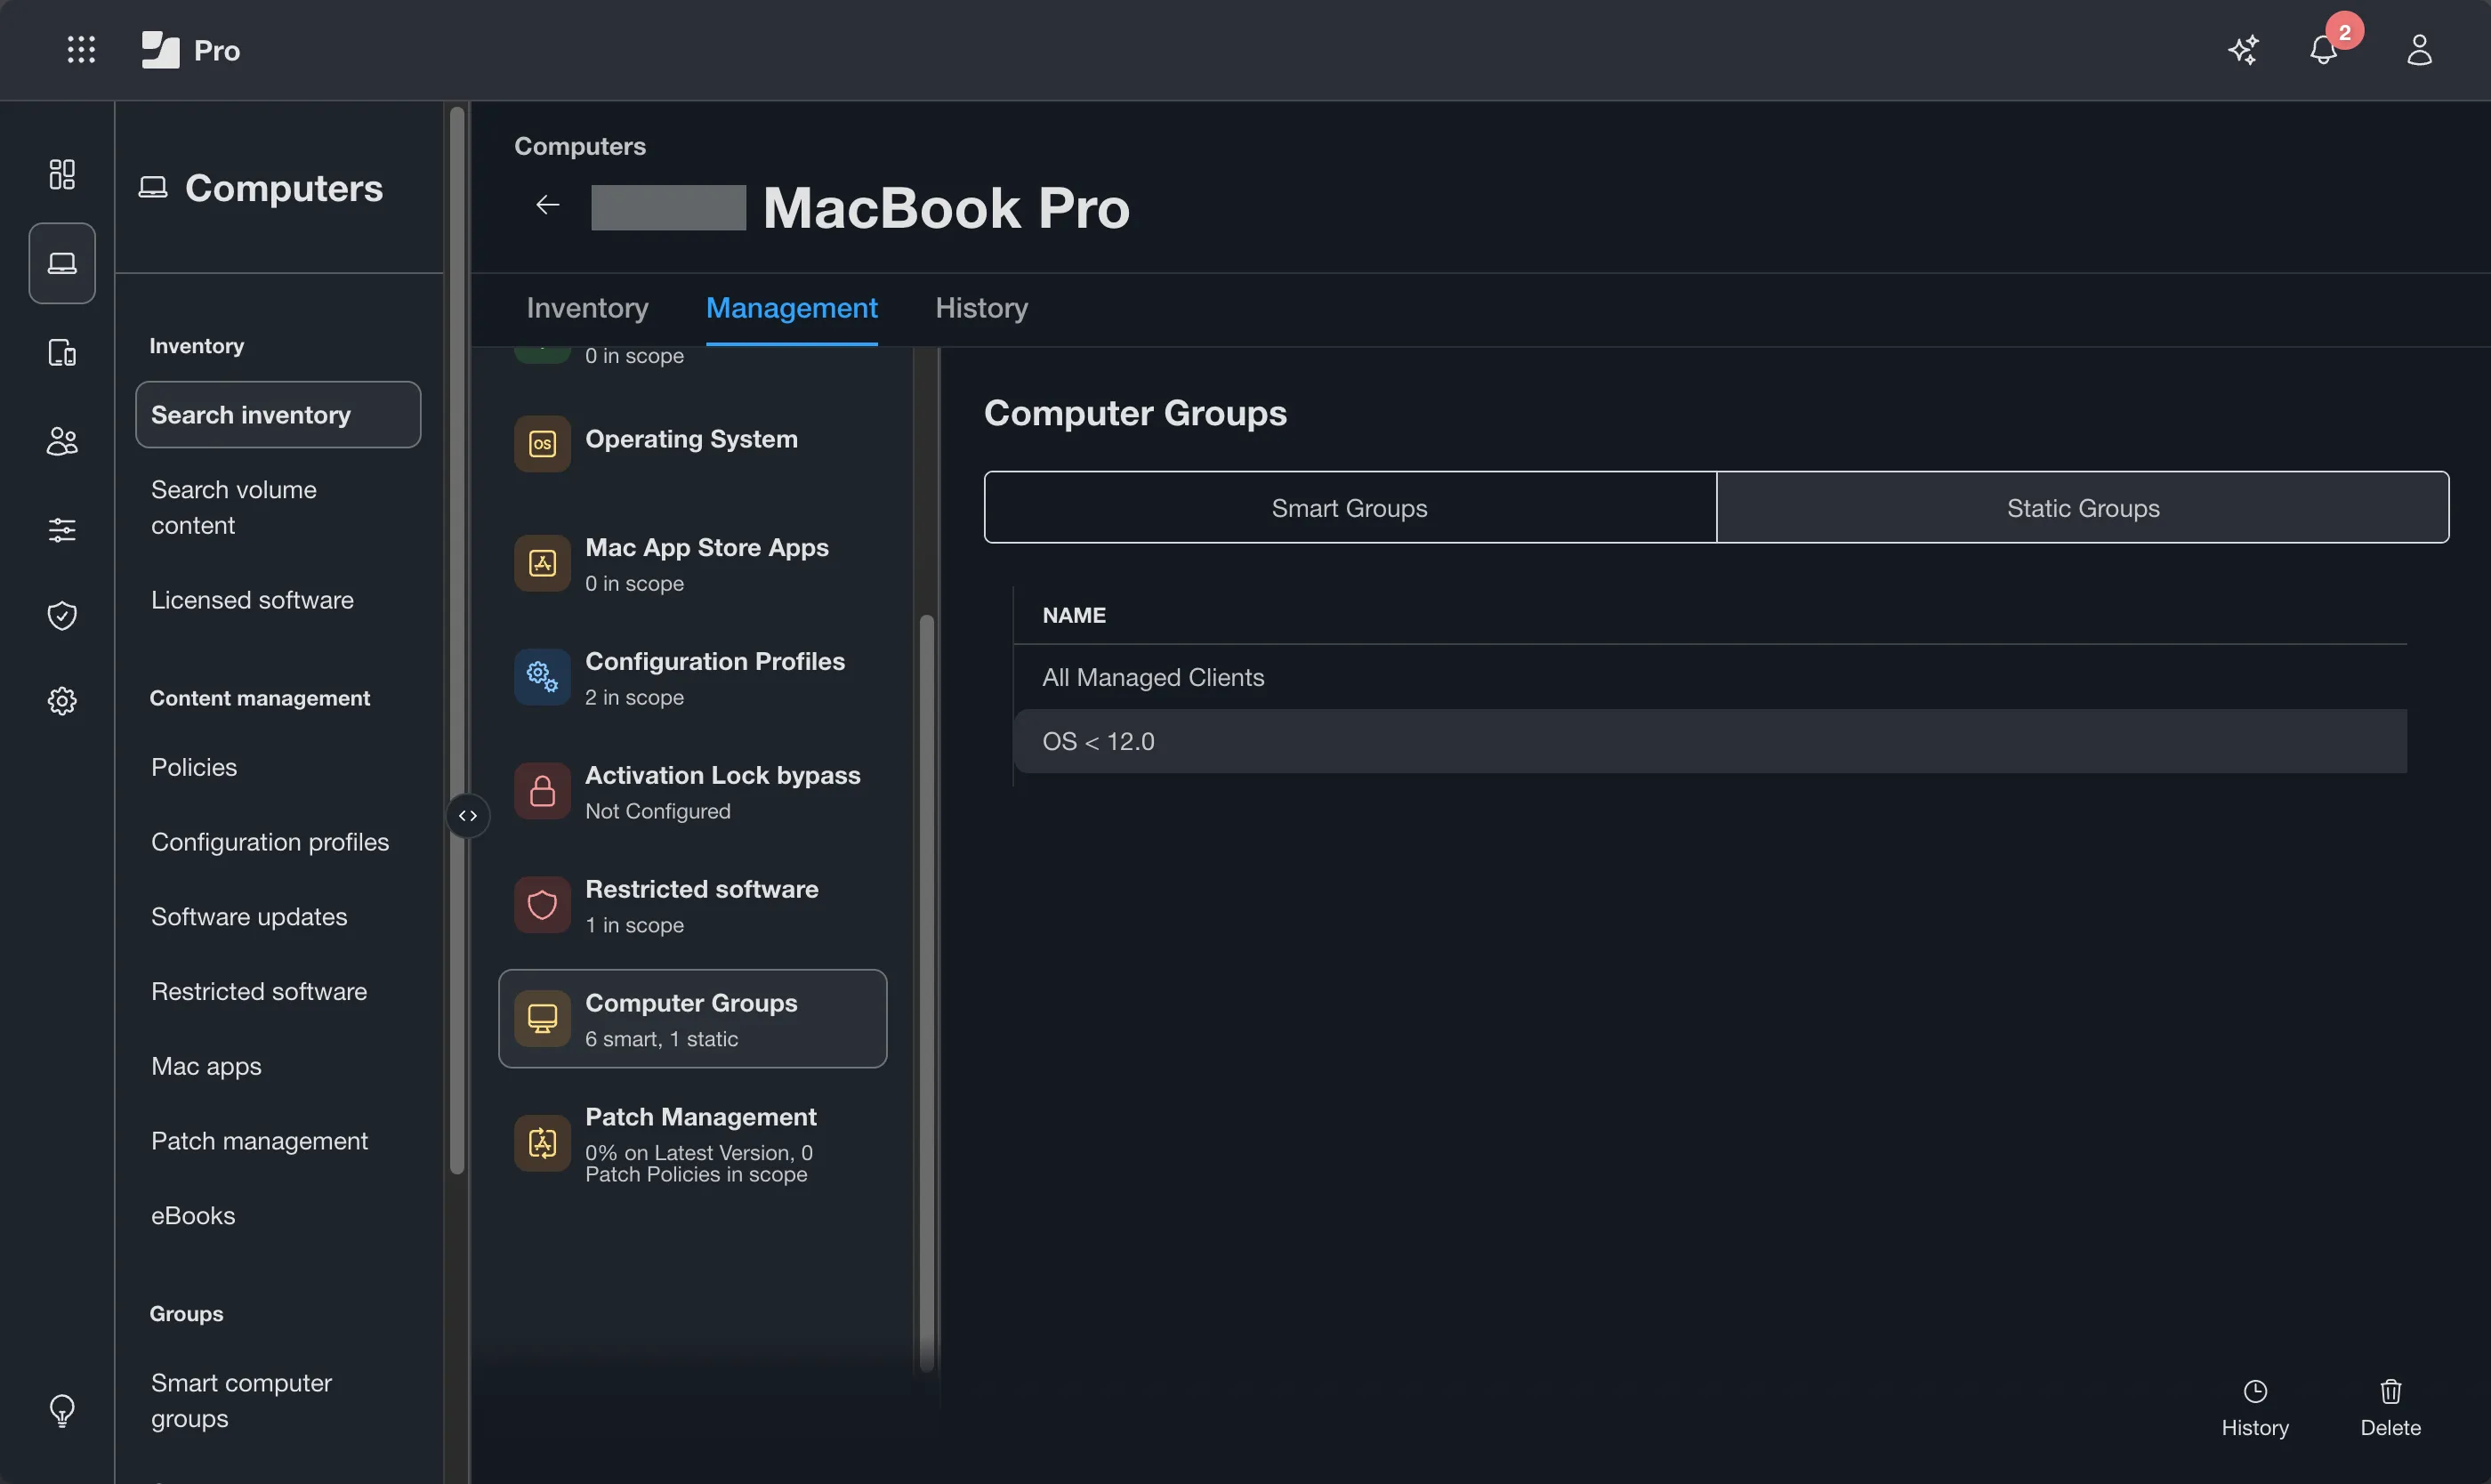
To verify a specific device’s current Smart Group memberships, navigate to the computer record, select the Management tab, then Computer Groups. This shows every Smart Group and Static Group the device currently belongs to, which makes it straightforward to determine why a device is or is not in scope for a given policy or profile.
The most common scoping problem: a device appears to be in scope but does not receive the policy because its inventory is stale. If the criteria for a Smart Group depend on a software version, an Extension Attribute value, or any other inventory data point, and that data has changed on the device but the device has not submitted an inventory update since the change, the Smart Group membership will not reflect reality.
When troubleshooting scope, always verify when the device last checked in and submitted inventory. The computer record’s General tab shows the Last Inventory Update timestamp. If that timestamp is old, running sudo jamf recon on the device will submit fresh inventory, allowing Jamf Pro to recalculate Smart Group membership.
Official documentation: Smart Groups
Inventory Collection — What Jamf Knows and When
Jamf Pro receives inventory information through several mechanisms: at the recurring check-in (if an Update Inventory policy is configured), when a policy explicitly includes the Update Inventory payload, when sudo jamf recon is run manually, through the declarative status channel, and at enrollment.
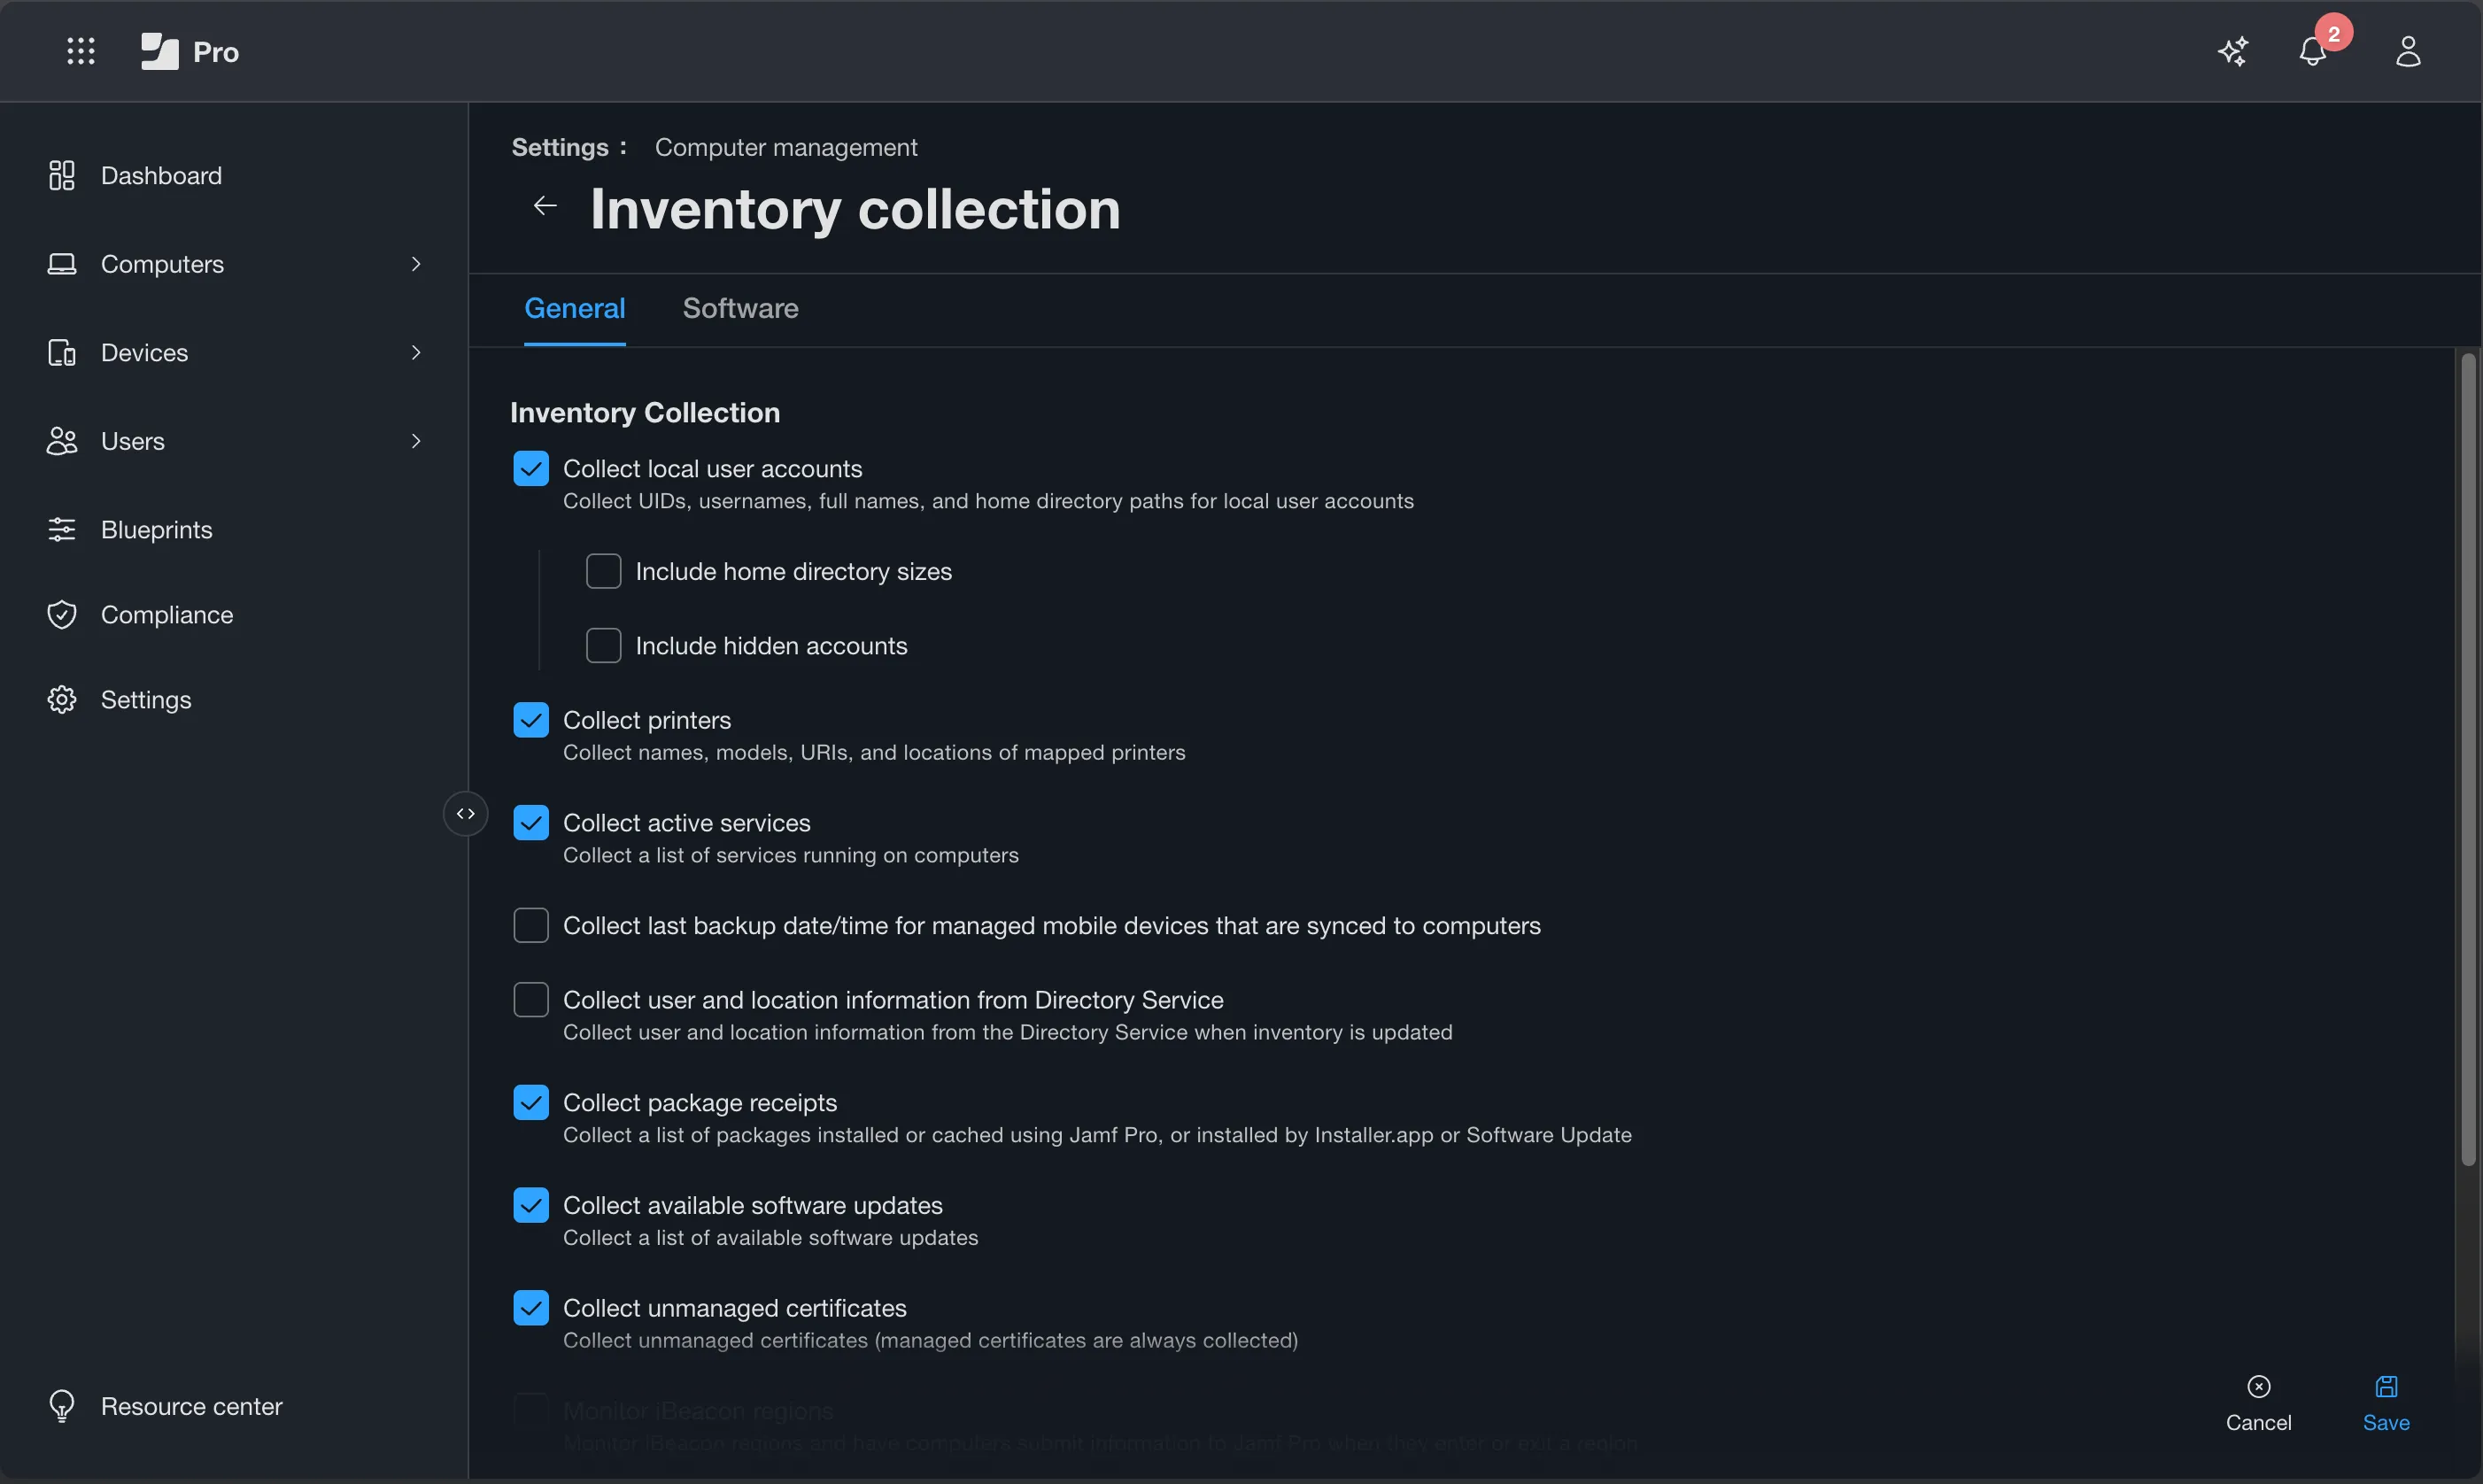
The categories of data Jamf Pro collects during inventory are configured under Settings → Computer Management → Inventory Collection. By default, Jamf collects hardware information, operating system data, and installed applications. Additional collection categories — fonts, plug-ins, local user accounts, home directory sizes — can be enabled or disabled here.
Extension Attribute scripts run as part of every inventory collection, which means frequent inventory updates on a large fleet can accumulate significant server and network load. This is relevant to your week one observation about how inventory collection policies are configured. A policy that runs inventory on all computers at every check-in on an Ongoing frequency is a meaningful operational risk.
Recurring check-in and inventory collection are not the same thing. A Mac may check for policies every 15 minutes while submitting its traditional full computer inventory much less frequently. A new Jamf Pro instance’s default Update Inventory policy runs once per week, but in an inherited environment, this frequency may be different.
Official documentation: Computer Inventory Collection Settings
Testing Without Breaking Production
The standard guidance for week two is to observe, not to change. But controlled observation often requires triggering something in a safe context. A dedicated test device and a static test group give you the infrastructure to do this safely.
Set up a static test group:
Create a Static Computer Group containing only your test device or devices. Name it clearly — something like TEST - Admin Test Devices — and use it as the scope for anything you want to evaluate before it touches production. A Static Group rather than a Smart Group is appropriate here because you are controlling membership manually and do not want unexpected devices joining the test scope through criteria evaluation. You choose exactly who joins the test population rather than relying on criteria evaluation to determine who is or is not in the test group.
Flush policy logs to re-run a Once policy:
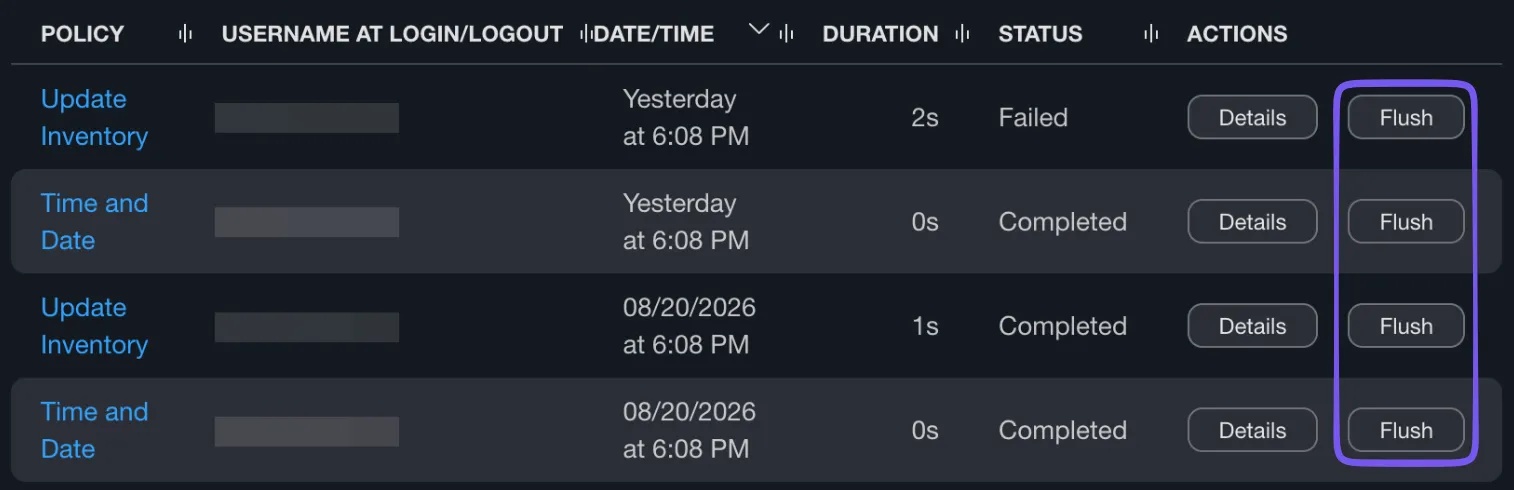
Policies set to Once per Computer will not run again on a device that has already executed them, even if you modify the policy. To force a re-run on a test device for evaluation purposes, navigate to the computer record, go to History → Policy Logs, find the policy, and click Flush to clear the log entry for that device. The policy will run again at the next check-in or when manually triggered.
Do not flush policy logs in production unless you intend the policy to run again on those devices. Flushing is a tool for controlled testing, not a general troubleshooting step. Flushing the log does not simply clear historical information for a Once per Computer policy; it can make that computer eligible to execute the policy again.
Profile Behavior — Managed vs. Manually Installed
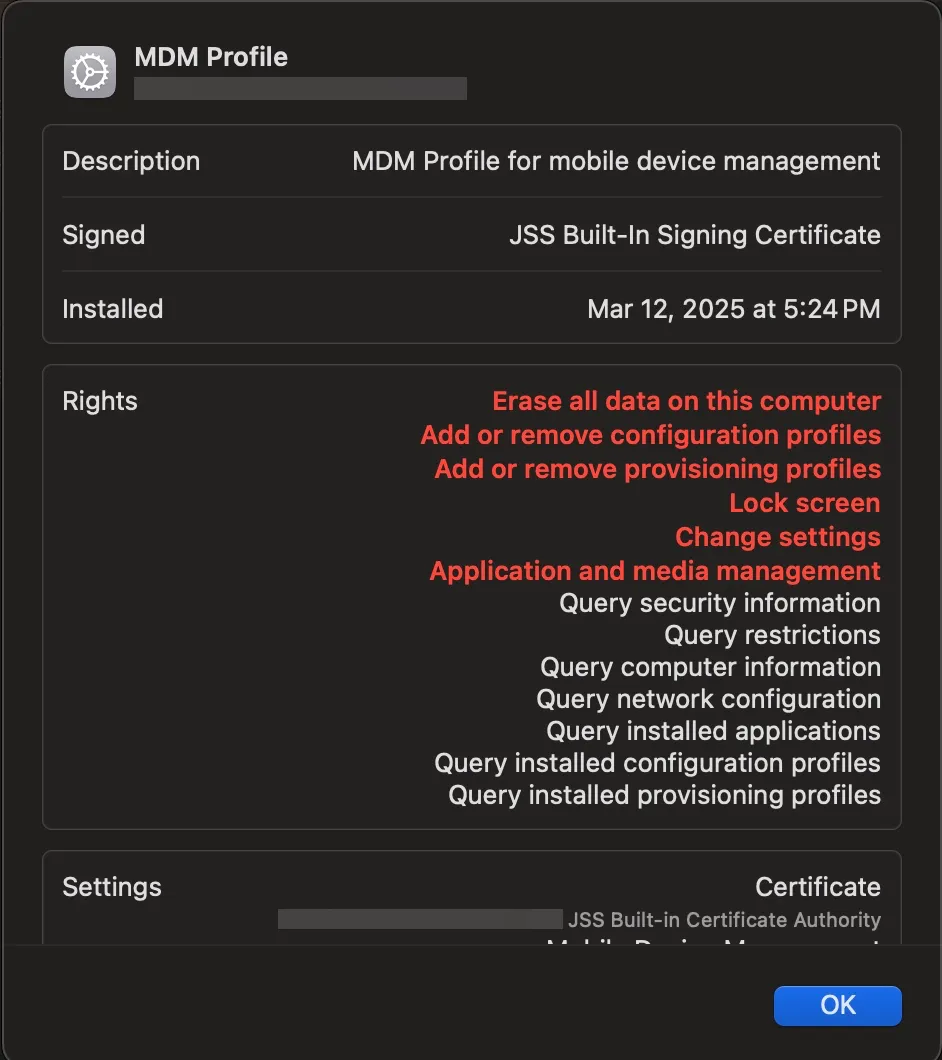
Configuration profiles installed through Jamf Pro are managed through Apple’s MDM framework. Once installed, Jamf Pro (not the end user) controls whether those profiles remain installed on the device.
Do not confuse an individual configuration profile with the MDM enrollment profile. They are related, but they are not the same thing. The enrollment profile establishes the management relationship between the device and Jamf Pro. Configuration profiles contain the settings that Jamf Pro enforces after enrollment.
What happens when scope changes?
When Jamf Pro determines that a device is no longer in scope for an automatically installed configuration profile, it sends an MDM command instructing the device to remove that profile. How quickly this occurs depends on Jamf Pro recognizing the scope change and the device being available for MDM communication.
Because configuration profiles are MDM-managed, profile deployment and removal do not wait for the recurring jamf binary policy check-in. They follow the MDM management workflow discussed earlier in this article.
Editing an existing profile
Editing an existing configuration profile introduces an important redistribution decision.
- Distribute to All replaces the profile on devices that already have it.
- Distribute to Newly Assigned Devices Only leaves existing devices unchanged and only delivers the updated profile to devices that enter scope in the future.
Do not treat this dialog as a routine confirmation prompt. Choosing the wrong option can unintentionally redistribute configuration changes across your entire fleet.
What to Produce by the End of Week Two
Week two ends with documented understanding, not with changes.
- A written record of the check-in frequency configured in your environment and whether it seems appropriate
- Confirmation that you can read
jamf.logon a managed Mac and correlate entries to specific policy executions you observed in the console - Familiarity with both the policy-level log view and the computer record’s History tab
- A Static Test Group containing at least one device you can safely use for controlled evaluation
- Answers to the open questions from your week one list — or a clearer understanding of which questions require week three access to answer
- A list of anything you observed that looks like it is not behaving as intended, documented for the backlog you will build in week four
- Confirmation that you understand the difference between recurring check-in, traditional inventory submission, MDM communication, and declarative status updates
You have not changed anything in production. That is still correct.
Download: Week 2 Operations Reference Card (
jamfagent), the check-in cycle, the everydayjamfbinary commands, where the logs live, and a Smart Group “why isn’t this device getting it?” troubleshooting checklist.
SHA256: AAF8D9C7E3433D0224637A4D5CB628FABB46E7397F6D2F578290F773D85DCA5F
Additional Resources
- Jamf Pro Documentation — Authoritative reference. When behavior changes between Jamf Pro releases, this reflects the current state.
- Jamf Training Catalog — The Jamf 200 course covers policy execution, scoping, and the management framework in depth. A natural next step after this series.
- Jamf Nation Community — The
#jamf-prodiscussion area and the search function are both useful when you encounter specific log errors or unexpected behavior. - MacAdmins Slack — The
#jamfchannel is the fastest path to an answer when you are looking at a log entry you have never seen before and need a second opinion.